There has been quite a debate about the stock market’s predictability over many decades. Stock analysts, researchers, fund managers, investors and traders have both expressed their thoughts and concerns about what determines the stock market movements.
Efficient Markets Hypothesis
Efficient Markets Hypothesis(EMH) represented the idea that the share prices reflect all information and consistent alpha generation is impossible. This hypothesis hence said the markets are efficient and the stock prices follow a random walk process. The idea was the prices follow no pattern and there is no way to predict where the prices are headed. EMH says that fundamental, technical and psychological factors determine the asset prices. The hypothesis has three different variants as weak, semi-strong and strong forms. In short, these forms say that all the information is available to the public and is incorporated in the prices, where no fundamental or technical analysis and even insiders cannot generate superior returns.
Hurst Exponent for Predictability
The Hurst Exponent is used as a measure of long term memory in a time series. As the stock prices are interpreted as time series data for FinBrain’s AI algorithms, understanding the time series characteristics is essential to generate reliable predictions. Hurst Exponents helps us to figure out if a series is mean reverting, random walk or trending.

In a Brownian motion there is no correlation between the observations of a time series. EMH suggests that the markets exhibit random walk characteristics, where the stock prices have no correlations with the historical values. A Hurst Exponent value close to 0.5 indicates that a series is following a Brownian motion. In this case, forecasting the market moving from the past prices is not possible.
A mean reverting movement is exhibited by anti-persistent time series where an increase is mostly followed by a decrease. A Hurst value between 0-0.5 indicates that the series have a tendency to revert back to its mean.
A Hurst exponent between 0.5-1 indicates a persistent time series and it is equivalent to trending market in financial terms. In this case an increase in the value of a time series is followed by an increase and vice versa.
Trading Strategies and The Hurst Exponent
Traders mostly utilize mean-reversion or momentum strategies to make money in the financial markets. When the return of an asset at time t depends on its return at time t-1, the returns are autocorrelated. In a mean-reverting regime, the returns are negatively correlated as an increase in the price is most likely to be followed by a decrease in the next time step. In a momentum regime, the returns are positively collected as an increase in the price is followed by an increase in the next time step.
In both mean-reverting and trending market regimes, the current price of an asset contains information about the future price. Trading strategies can only generate profits if the prices are either trending or mean reverting, as the random walk (Hurst=0.5) process is random and unpredictable.
Efficient Markets Hypothesis(EMH) is only true when the Hurst Exponent is equal to 0.5 or is in a very narrow neighborhood of 0.5. However, Hurst is not always equal to 0.5 and it indicates that EMH which says the markets are completely unpredictable, is often violated. By incorporating Hurst Exponent into the calculations, FinBrain Technologies adjusts the weights given to mean reversion or momentum strategies to increase predictability. AI Model input parameters are adjusted according to current market conditions in order to ensure high prediction accuracy.
A Data Driven Approach to Stock Prediction
90% of the world’s data has been created in the last two years. Huge amounts of data is generated every second, and analysts are trying to create models to extract features from data. Data is the new commodity in the information age. The ability to collect, analyze and interpret the data determines the success of an organization in today’s world.
Financial markets generate massive amounts of qualitative and quantitative data every single day, in the form of numbers, reports, news, press releases and so on. Organizing, interpreting and learning from gigabytes of data every single day, is beyond humans’ capacity. However, AI models such as Machine Learning and Deep Learning are specifically designed to operate on and learn from vast amounts of data. A well constructed model can extract the dynamics of how a stock’s price is formed, by analyzing a diverse set of data.
FinBrain collects stock data: daily open, high, low, close, volume values, technical indicators, company financials and news/reports in order to build models that learn how these predictors affect the stock prices. We incorporate as much data as we can to increase the robustness and prediction accuracy of our algorithms. We train Deep Neural Network models based on the data we collected for more than 6000 stocks, commodities, foreign currency pairs and exchange traded funds on a daily basis. The trained models then predict where the asset prices will be heading to in the next 10 day period based on what it learned from the historical financial data.
FinBrain’s Predictability Indicator
FinBrain’s algorithms collect, organize and feed the financial datasets to the Deep Neural Networks in order to analyze and predict the stock prices. Figuring out the behavior of the stock prices and correctly involving the right predictors in the dataset is substantial when it comes to training a Deep Learning model. However, we need to come up with a value to measure how predictable the stocks are for the given time period. This is important in order to take the safest trades that maximize returns and minimize risks.
FinBrain has constructed a special predictability analysis algorithm that calculates how predictable an asset is, by incorporating Hurst Exponent, Volatility and Coefficient of Determination(R-squared). Both of these concepts are merged into a single algorithm in order to provide a robust predictability indicator value that helps our customers to take safe trades.

How to Utilize the Predictability Indicator
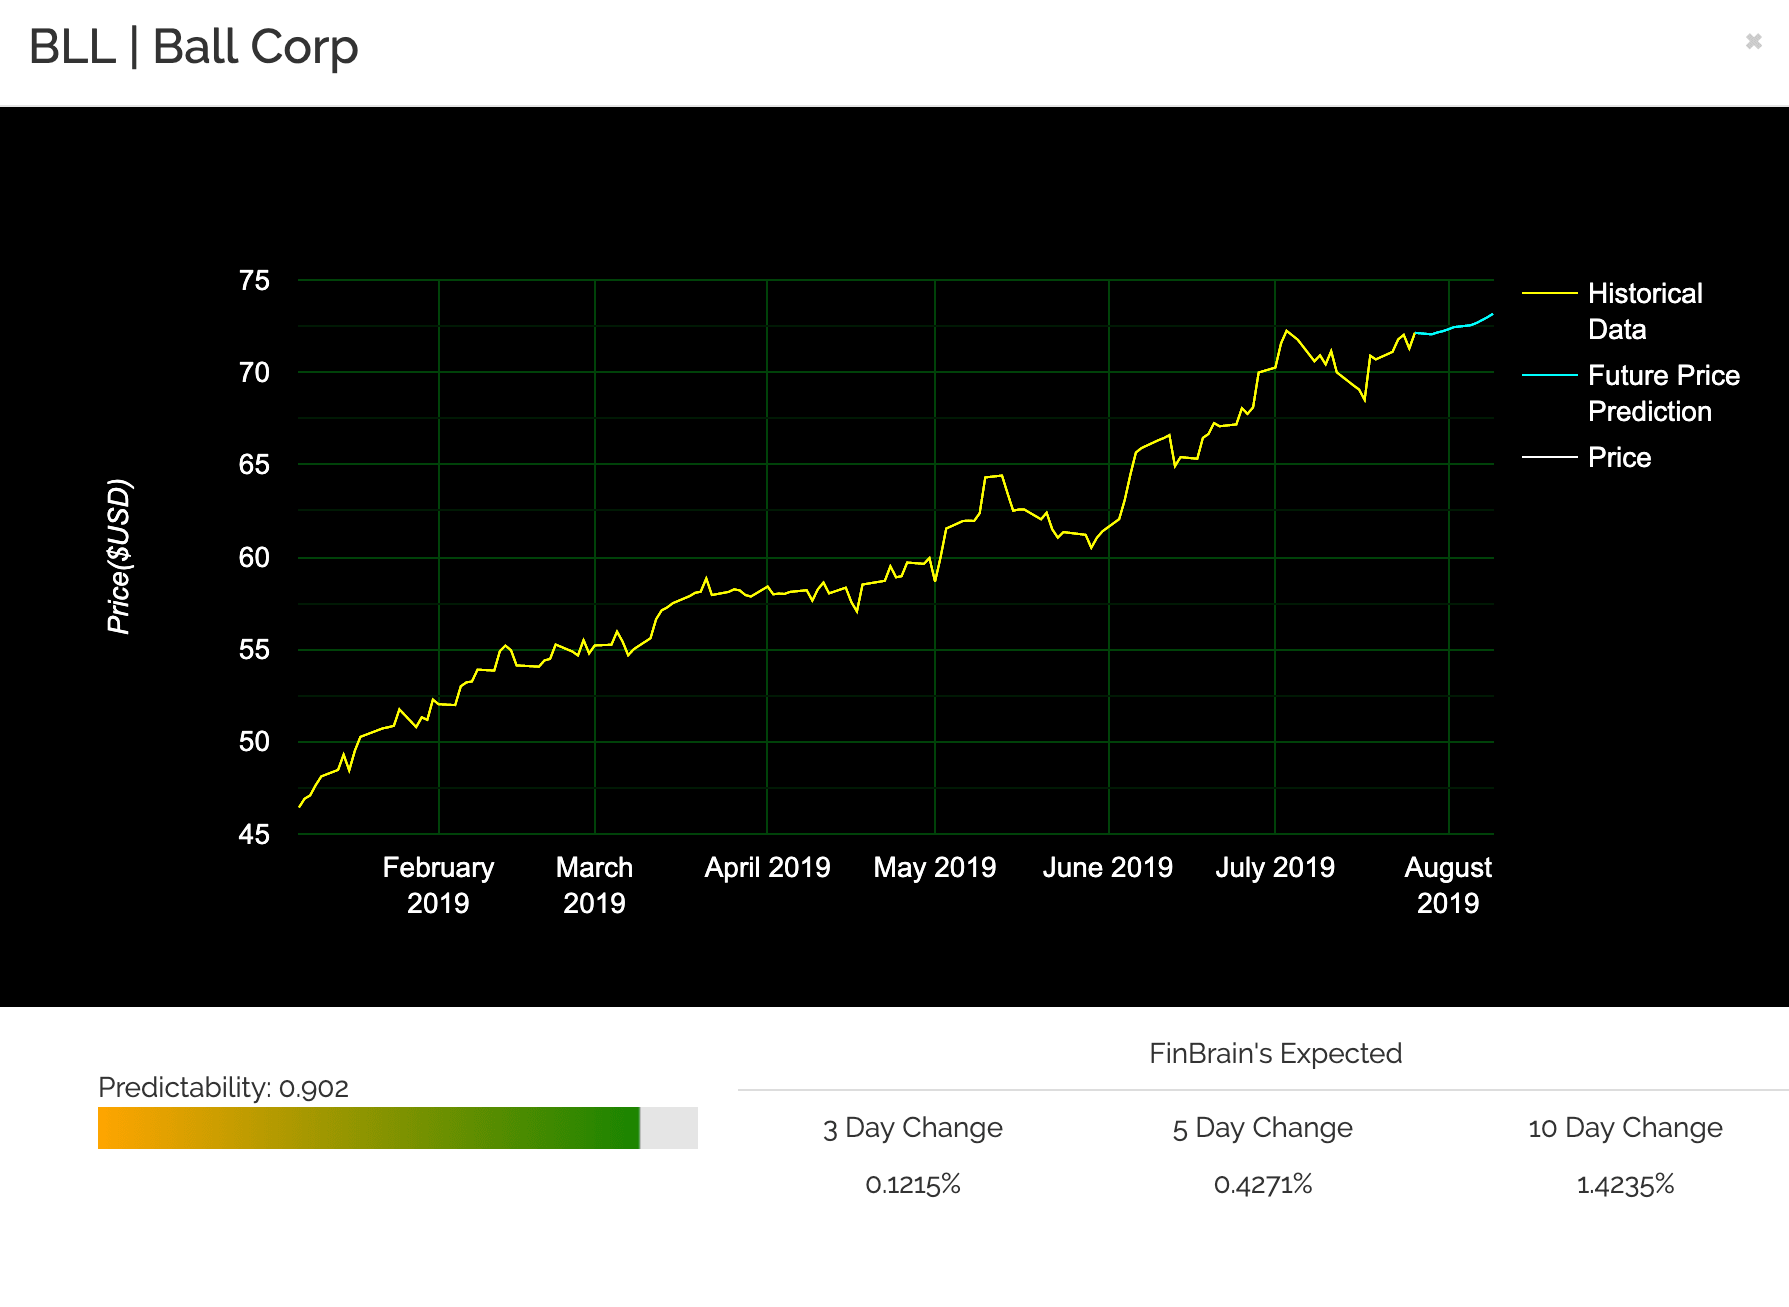
A high predictability indicator shows that the forecasts for the asset is more likely to happen, and the risk of deviating from the forecasted values is lower. A low predictability indicator shows that the stock can make moves outside of the predicted pattern and the risk of deviation is higher.
Our customers can filter the assets listed under S&P500, NASDAQ, NYSE, Dow30, Foreign Exchange, Commodities, Cryptocurrencies and ETFs markets based on Expected Change Values for 3-day, 5-day and 10-day periods as well as based on the Predictability Indicator.

We would like to remind you that our customers from more than 130 countries are maximizing their investment returns and minimizing their losses by referring to FinBrain’s predictions. Our prediction services indicate the safest trades to take thanks to the Predictability Indicator, the highest return stocks and where every single asset is forecasted to move under the given markets. Don’t be late to utilize our services and enjoy a 20% discount on the prices when you subscribe.
We wish you a successful week.
FinBrain Technologies