In today’s hypercompetitive financial markets, the difference between profit and loss often comes down to milliseconds and data quality. While hedge funds invest millions in alternative data infrastructure, individual traders and smaller institutions have been left behind — until now.
The FinBrain Python SDK democratizes access to the same caliber of alternative datasets that power the world’s most sophisticated trading strategies. With just a single import and one line of authentication, you gain instant access to deep-learning price predictions, real-time sentiment analysis, insider trading patterns, and exclusive corporate intelligence that traditionally required entire teams of data scientists to collect and process.
Why Alternative Data is Your Competitive Edge
Traditional market analysis relies on price, volume, and publicly reported financials — data that everyone has access to. But markets move on information asymmetry. The traders who spot trends first, who understand sentiment shifts before they’re reflected in prices, who track insider behavior patterns — these are the ones who consistently outperform.
FinBrain’s alternative datasets give you:
- Predictive Power: AI-driven price forecasts trained on billions of data points
- Sentiment Intelligence: Real-time pulse of market psychology from news and social signals
- Insider Insights: Track what company executives and politicians are actually doing with their money
- Corporate Health Metrics: LinkedIn employee trends and app ratings that reveal company momentum before earnings reports
- Options Flow Intelligence: Understand where smart money is positioning through put/call ratios
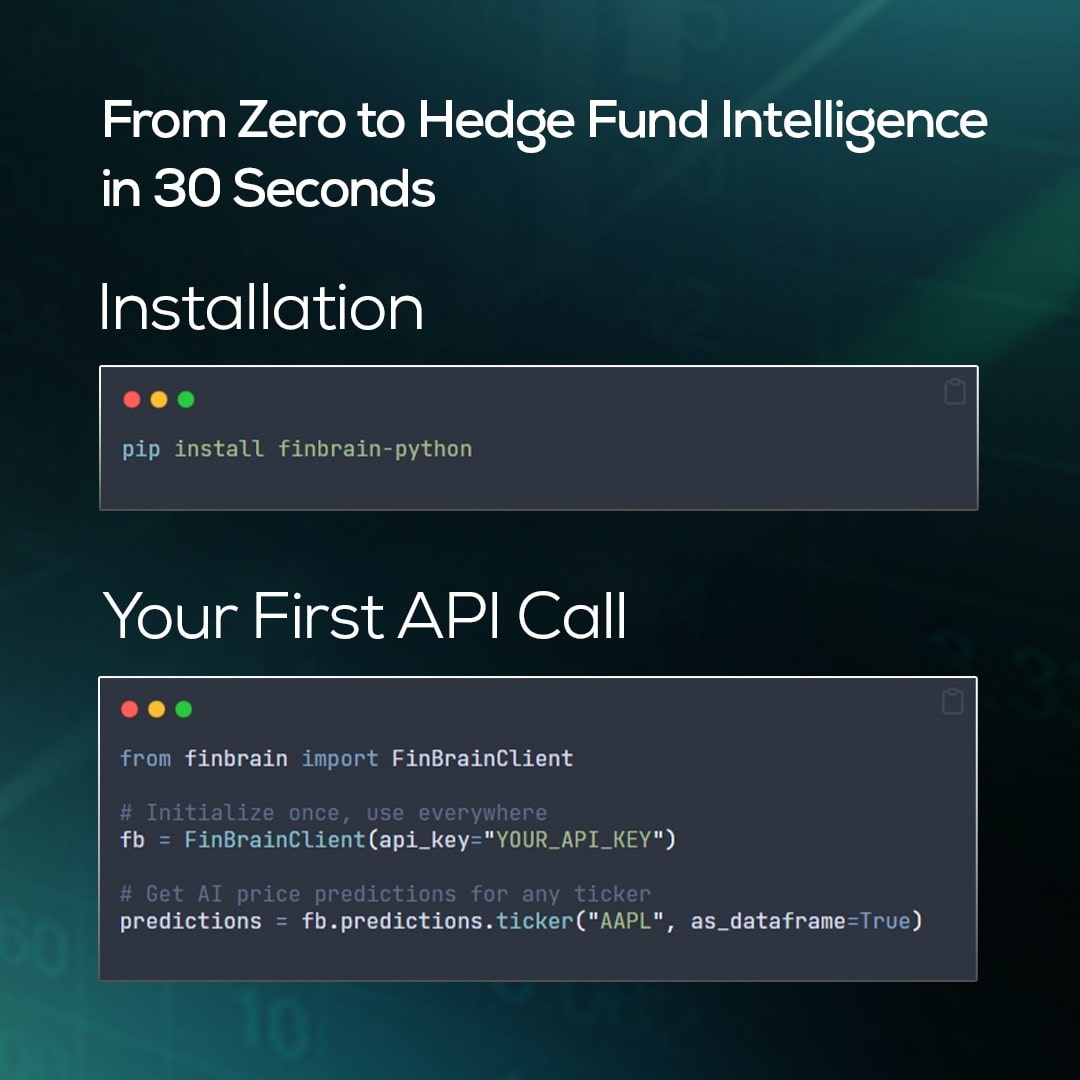
Getting Started in 30 Seconds
Installation
pip install finbrain-python
Your First API Call
from finbrain import FinBrainClient

# Initialize once, use everywhere
fb = FinBrainClient(api_key="YOUR_API_KEY")

# Get AI price predictions for any ticker
predictions = fb.predictions.ticker("AAPL", as_dataframe=True)
That’s it. No complex configurations, no dependency hell, no learning curve. If you can write Python, you can access hedge fund-grade data in seconds.
Deep Dive: Our Alternative Datasets
1. AI-Powered Price Predictions
Our deep learning models analyze millions of data points — from technical indicators to alternative data signals — to generate probabilistic price forecasts with confidence intervals.
What Makes It Powerful:
- Daily and monthly prediction horizons
- Confidence bands (high/mid/low scenarios)
- Technical analysis integration
- Continuously retrained on latest market conditions
Implementation:
# Get predictions for a single ticker
tesla_forecast = fb.predictions.ticker("TSLA", as_dataframe=True)

# Analyze entire market segments
sp500_predictions = fb.predictions.market("S&P 500", as_dataframe=True)

# Visualize with built-in plotting
fb.plot.predictions("TSLA", show=True)
Use Cases:
- Position sizing based on confidence intervals
- Risk management through downside scenario planning
- Market timing for entry and exit points
- Portfolio rebalancing signals
2. News Sentiment Analysis
Our NLP models process thousands of news articles per minute, extracting not just sentiment but the intensity and relevance of coverage for each ticker.
What Makes It Powerful:
- Real-time processing of global news sources
- Entity-specific sentiment extraction
- Historical sentiment trends for backtesting
- Correlation with price movements
Implementation:
# Visualize sentiment trends
fb.plot.sentiments("S&P 500", "AAPL", date_from="2025-01-01")
Use Cases:
- Sentiment-based trading signals
- Event-driven strategy development
- Market psychology indicators
- Risk-off trigger identification
3. Insider Trading Intelligence
Track every SEC Form 4 filing in real-time, with normalized transaction data that reveals true insider sentiment beyond the noise.
What Makes It Powerful:
- Real-time SEC filing integration
- Transaction normalization for comparison
- Relationship mapping (CEO, CFO, Director, etc.)
- Aggregate insider sentiment scoring
Implementation:
# Get recent insider transactions
insider_moves = fb.insider_transactions.ticker(
    "S&P 500", "MSFT",
    as_dataframe=True
)

# Filter for significant transactions
major_buys = insider_moves[
    (insider_moves['transaction'] == 'Purchase') &
    (insider_moves['USDValue'] > 1000000)
]

print(major_buys)Use Cases:
- Follow smart money movements
- Identify accumulation/distribution phases
- Corporate governance red flags
- M&A activity prediction
4. Congressional Trading Patterns
Monitor trades by US House members with detailed transaction records, amounts, and timing — data that often predicts regulatory changes and sector rotations.
What Makes It Powerful:
- Complete House trading records
- Transaction size estimates
- Representative identification
- Sector and ticker aggregation
Implementation:
# Track political trading activity
house_trades = fb.house_trades.ticker(
    "S&P 500", "NVDA",
    date_from="2024-01-01",
    as_dataframe=True
)

print(house_trades)
Use Cases:
- Regulatory change prediction
- Sector rotation signals
- Policy-driven investment themes
- Political risk assessment
5. Options Flow Analysis
Real-time put/call ratios and options volume analysis reveal where institutional traders are placing their bets.
What Makes It Powerful:
- Intraday put/call ratio tracking
- Volume-weighted analysis
- Strike price distribution
- Expiration clustering patterns
Implementation:
# Analyze options sentiment
options_data = fb.options.put_call(
    "S&P 500", "NVDA",
    date_from="2025-01-01",
    as_dataframe=True
)

# Identify unusual options activity
if options_data['ratio'].iloc[-1] > 1.5:
    print("Warning: Extreme bearish positioning detected")

# Visualize put/call trends
fb.plot.options("S&P 500", "NVDA", kind="put_call")Use Cases:
- Market sentiment gauging
- Volatility prediction
- Support/resistance identification
- Hedge timing optimization
6. LinkedIn Corporate Intelligence
Track employee growth, follower trends, and corporate health metrics that often precede official announcements.
What Makes It Powerful:
- Weekly employee count updates
- Follower growth momentum
- Department-level insights (when available)
- Historical trend analysis
Implementation:
# Monitor corporate health
linkedin_metrics = fb.linkedin_data.ticker(
    "S&P 500", "AAPL",
    date_from="2024-01-01",
    as_dataframe=True
)

# Visualize workforce trends
fb.plot.linkedin("S&P 500", "AAPL")

# Detect expansion or contraction
growth_rate = linkedin_metrics['employeeCount'].pct_change().mean()
Use Cases:
- Early layoff detection
- Growth momentum indicators
- Competitive analysis
- Hiring freeze identification
7. App Store Intelligence
Mobile app ratings and review volumes provide real-time consumer sentiment for companies with digital products.
What Makes It Powerful:
- Daily rating updates from App Store and Google Play
- Review volume tracking
- Install count estimates
- Cross-platform comparison
Implementation:
# Track app performance
app_metrics = fb.app_ratings.ticker(
    "NYSE", "UBER",
    date_from="2025-01-01",
    as_dataframe=True
)

# Compare iOS vs Android sentiment
fb.plot.app_ratings("NYSE", "UBER", store="app")  # iOS
fb.plot.app_ratings("NYSE", "UBER", store="play") # Android

# Detect product issues early
if app_metrics['appStoreScore'].iloc[-7:].mean() < 3.5:
    print("Alert: Significant app quality issues detected")
Use Cases:
- Product launch success tracking
- Customer satisfaction monitoring
- Competitive benchmarking
- Digital transformation progress
8. Wall Street Analyst Consensus
Aggregated analyst ratings, price targets, and recommendation changes from major investment banks.
What Makes It Powerful:
- Real-time rating updates
- Price target distributions
- Institution-level tracking
- Consensus change momentum
Implementation:
# Get analyst consensus
analyst_views = fb.analyst_ratings.ticker(
    "S&P 500", "GOOGL",
    date_from="2025-01-01",
    as_dataframe=True
)

# Extract key metrics
bullish_pct = (analyst_views['signal'] == 'Buy').mean()

print(f"Bullish Analyst Percentage: {bullish_pct:.2%}")

# Track institutional sentiment shifts
recent_changes = analyst_views.tail(10)

print(recent_changes)
Use Cases:
- Institutional sentiment tracking
- Price target validation
- Upgrade/downgrade momentum
- Contrarian signal generation
Advanced Features That Set Us Apart
Intelligent Error Handling
from finbrain.exceptions import BadRequest, NotFound, AuthenticationError

try:
    data = fb.predictions.ticker("INVALID")
except BadRequest as e:
    # Graceful fallback with clear error messages
    print(f"Invalid ticker: {e}")
except NotFound as e:
    # Invalid ticker or resource doesn't exist
    print(f"Resource not found: {e}")
except AuthenticationError:
    # API key issues handled separately
    print("Please check your API key")
Built-in Data Visualization
No need for matplotlib gymnastics. Our plotting functions create publication-ready charts with one line:
# Create interactive Plotly charts
fb.plot.predictions("TSLA")
fb.plot.sentiments("S&P 500", "TSLA")
fb.plot.options("S&P 500", "SPY", kind="put_call")

# Export for reports
fig_json = fb.plot.predictions("TSLA", as_json=True)
Integration Patterns for Professional Workflows
The true power of alternative data emerges when you combine multiple uncorrelated signals into robust trading strategies. These patterns demonstrate how quantitative researchers and portfolio managers can leverage the FinBrain SDK to build institutional-grade systems.
Pattern 1: Multi-Signal Trading System
Modern quantitative trading relies on signal fusion — combining orthogonal data sources to reduce false positives and increase conviction. This pattern implements a triple-confirmation system that mirrors how systematic hedge funds approach trade selection.
def alpha_signal(ticker):
    # AI says up, insiders buying, sentiment positive
    ai = fb.predictions.ticker(ticker)
    insider = fb.insider_transactions.ticker("S&P 500", ticker, as_dataframe=True)
    sentiment = fb.sentiments.ticker("S&P 500", ticker, as_dataframe=True)

    # Check multiple conditions
    ai_bullish = float(ai['prediction']['expectedShort']) > 2.0  # >2% expected gain

    # Recent insider buying activity
    recent_insider = insider.tail(10)
    insider_buying = len(recent_insider[recent_insider['transaction'] == 'Buy']) >= 3

    # Sentiment turning positive (above neutral)
    sentiment_positive = sentiment['sentiment'].tail(5).mean() > 0.25

    if ai_bullish and insider_buying and sentiment_positive:
        return "STRONG BUY 🚀"
Pattern 2: Risk Management Dashboard
Professional risk management goes beyond simple stop-losses. This pattern creates a multi-dimensional risk assessment framework that quantifies downside exposure across different time horizons and market regimes.
def portfolio_risk_assessment(portfolio_tickers):
    risk_metrics = {}

    for ticker in portfolio_tickers:
        # Gather risk indicators
        predictions = fb.predictions.ticker(ticker, as_dataframe=True)
        options = fb.options.put_call("S&P 500", ticker, as_dataframe=True)
        sentiment = fb.sentiments.ticker("S&P 500", ticker, as_dataframe=True)

        downside_pct = ((predictions['lower'].iloc[-1] - predictions['main'].iloc[-1]) / predictions['main'].iloc[-1]) * 100

        risk_metrics[ticker] = {
            'downside_risk_%': round(downside_pct, 2),
            'put_call_ratio': options['ratio'].iloc[-1],
            'sentiment_score': sentiment['sentiment'].tail(5).mean()
        }

    return pd.DataFrame(risk_metrics).T
Generated risk metrics for AAPL, TSLA and AMZN using the portfolio risk assessment function is given as below:
        downside_risk_%	  put_call_ratio	  sentiment_score
AAPL	            -7.36	            0.53	          0.0412
TSLA	            -12.03	          0.83	          0.1120
AMZN -7.11 0.64 0.2652Pattern 3: Automated Alerting
Alpha generation often depends on speed of execution. This pattern implements event-driven monitoring that identifies accumulation patterns before they’re reflected in price — a classic information arbitrage strategy.
def monitor_insider_activity(watchlist):
    alerts = []

    for ticker in watchlist:
        transactions = fb.insider_transactions.ticker("S&P 500", ticker, as_dataframe=True)
        recent = transactions[transactions.index >= '2025-01-20']

        if len(recent[recent['transaction'] == 'Purchase']) >= 3:
            alerts.append(f"Multiple insider buys detected for {ticker}")

    return alerts
Building Your Quantitative Edge
These patterns form the building blocks of a systematic trading infrastructure. By combining them, you can create:
- Factor Models: Use sentiment as a risk factor alongside traditional Fama-French factors
- Mean Reversion Strategies: Trade divergences between AI predictions and current prices
- Event Arbitrage: Capitalize on the lag between insider actions and market recognition
- Portfolio Optimization: Dynamically rebalance based on real-time risk metrics
The key insight is that alternative data provides orthogonal signals to traditional price-volume analysis. When properly integrated into a quantitative framework, these signals can significantly improve Sharpe ratios and reduce maximum drawdowns — the holy grail of systematic trading.
Performance & Reliability
- 99.9% API Uptime: Enterprise-grade infrastructure ensures your strategies never miss a beat
- Sub-second Response Times: Optimized endpoints deliver data when you need it
- Automatic Retries: Built-in retry logic handles transient network issues
- Rate Limit Management: Intelligent throttling prevents disruptions
- Data Freshness: Most datasets update multiple times daily
Pricing That Makes Sense
Unlike traditional data vendors that charge tens of thousands per month, FinBrain’s API access starts at a fraction of the cost. You’re not paying for a Bloomberg Terminal you’ll use 10% of — you’re paying for exactly the data you need, when you need it.
Start Building Today
The financial markets don’t wait, and neither should you. Every day without alternative data is a day your competitors have an edge.
- Get Your API Key: Subscribe at finbrain.tech
- Install the SDK:
pip install finbrain-python - Run Your First Analysis: Copy any code example above
- Join Our Community: Share strategies and get support
What’s Next?
The FinBrain SDK is continuously evolving. We’re adding new datasets monthly, enhancing our ML models quarterly, and building integrations with popular trading platforms. Our roadmap includes:
- Additional alternative datasets (satellite data, web traffic, social media metrics)
- Enhanced ML predictions with explainability features
- Direct broker integrations for automated trading
- Real-time WebSocket streams for latency-sensitive strategies
Conclusion: Your Unfair Advantage Awaits
In a world where microseconds matter and information is power, the FinBrain Python SDK puts institutional-grade intelligence at your fingertips. Whether you’re a quantitative researcher building the next breakthrough strategy, a portfolio manager seeking alpha, or a developer creating the future of fintech — we’ve built this for you.
Stop trading blind. Start trading smart.
# Your journey to smarter trading starts here
from finbrain import FinBrainClient
fb = FinBrainClient(api_key="YOUR_KEY")

# The markets are waiting. What will you build?
Ready to level up your trading? Get started with FinBrain API at finbrain.tech. Have questions? Reach out to our team at [email protected].
FinBrain Technologies — Terminal & API for global coverage and alternative data
Talk to us: [email protected] • www.finbrain.tech
Follow: Twitter • LinkedIn • Instagram • Facebook
© 2025 FinBrain Technologies