Introduction
Welcome to our insightful exploration where we delve into the transformative world of stock market forecasting and analysis. This article is meticulously crafted to cover three key areas: the Bank of America Case Study for the Predictive Power of AI Algorithms and Alternative Data, and the exciting New Additions to FinBrain Terminal.
First, we embark on a detailed case study of Bank of America, showcasing the remarkable predictive capabilities of AI algorithms and the valuable insights provided by alternative data. This section illuminates how cutting-edge technology is reshaping our understanding of stock market trends and investment strategies.
Next, we shift our focus to the latest innovations at FinBrain. These new additions are revolutionizing the way investors and analysts interact with market data, offering advanced tools and features that enhance decision-making and market analysis.
Join us as we navigate through these fascinating topics, offering a glimpse into the future of stock market analysis and the incredible potential of AI and alternative data in investment strategies.
Bank of America Case Study for the Predictive Power of AI Algorithms and Alternative Data
In an era where technology plays a pivotal role in financial markets, artificial intelligence (AI) algorithms and alternative datasets have emerged as powerful tools for predicting stock market trends.
This case study delves into a real-world case study of Bank of America Corp (BAC), analyzing the predictive performance of these advanced tools. We will explore how AI algorithms, particularly those employed by FinBrain Terminal, have influenced the BAC stock forecast.
About Bank of America Corp
Founded over a century ago, Bank of America Corp (BAC) stands as a titan in the financial sector. It offers a diverse range of banking and financial products and services to individuals, small and large businesses, and governments.
With a workforce of 217,000 employees, BAC holds a significant market cap of $234.642 billion. Despite facing a Year-To-Date (YTD) stock performance decline of -11.64%, the company maintains a robust Price-to-Earnings (P/E) ratio of 8.30. Notably, BAC offers a dividend of $0.86 per share, translating to a commendable dividend yield of 3.24%.
AI Predictions and Alternative Data Analysis
Predictive Performance of FinBrain’s AI
FinBrain’s AI algorithms have demonstrated remarkable accuracy in predicting BAC’s stock movements. This is particularly evident in their 10-day ahead predictions between November 8 and November 21, 2023. With a Normalized Mean Squared Error (NMSE) of just 0.509, these predictions showed a high degree of precision, closely mirroring the actual stock price movements of Bank of America.
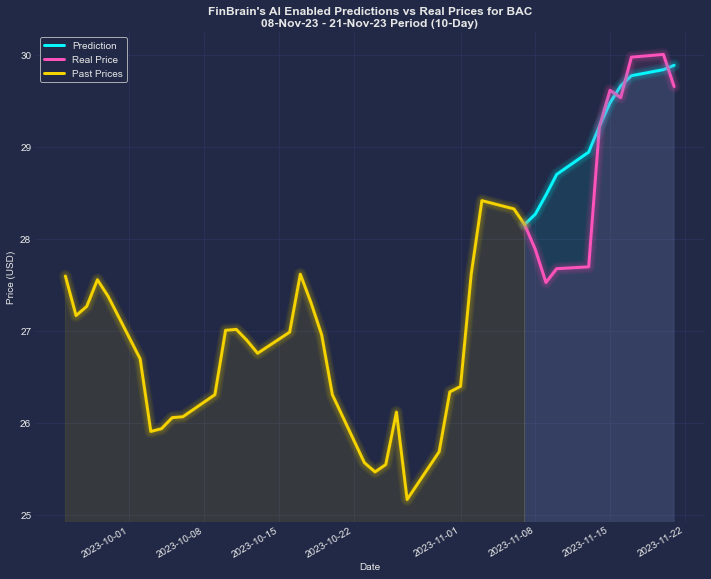
On the eve of the forecast period, November 7, 2023, BAC’s stock closed at $28.16. FinBrain’s AI algorithms predicted a rise in the stock’s price to $29.89 by the end of the forecast period, a projected increase of 6.15%. The actual closing price on the last day of the period was $29.66, reflecting a real increase of 5.33%. This minor discrepancy highlights the predictive power of FinBrain’s AI technology in forecasting stock price movements.
Alternative Data Insights
In addition to traditional financial metrics, FinBrain incorporates alternative data into its analysis to provide a more comprehensive view of BAC’s stock performance.
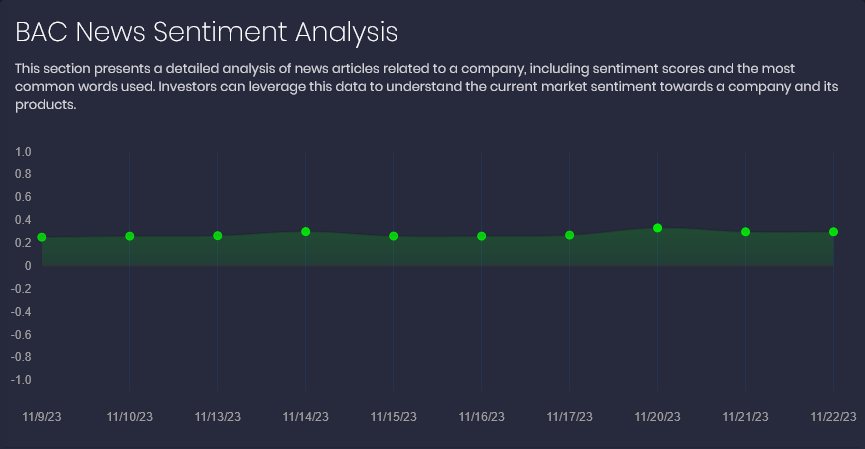
A key aspect of this data is the news sentiment score, which remained positive for BAC throughout the entire period. This positive sentiment suggested an optimistic outlook for the company.
Furthermore, insider transactions, particularly those involving company executives, leaned heavily towards buys and stock buybacks. These transactions are often seen as a strong vote of confidence in the company’s future prospects. Notably, the most recent insider buys occurred on November 8 and November 1, 2023.
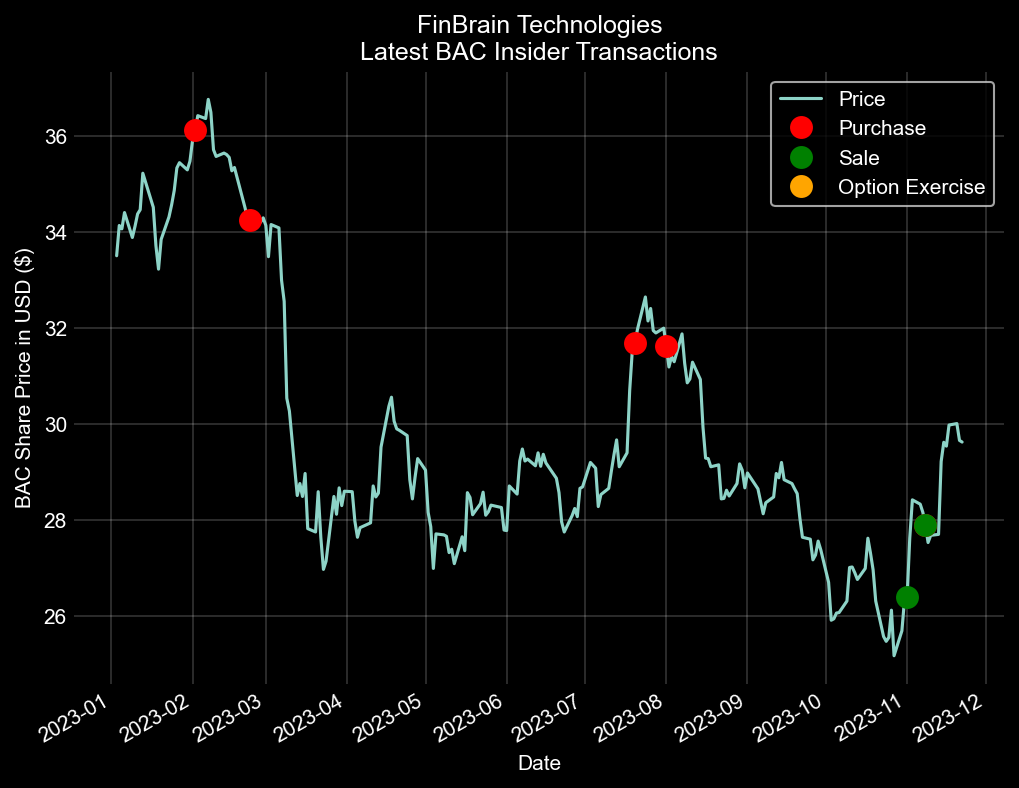
The stock price of BAC showed an uptrend following these purchases, reinforcing the positive sentiment indicated by other data points. This correlation between insider buying activity and stock price movement is crucial for investors seeking to gauge the internal confidence of company executives in the firm’s future performance.
The combination of AI-driven forecasts, positive news sentiment, and confident insider transaction patterns paint a promising picture for BAC. Such alternative data points provide investors with deeper insights, augmenting traditional analysis methods and enabling more informed investment decisions.
Explore the New Additions to FinBrain
FinBrain Terminal has introduced a groundbreaking feature that significantly enhances the user experience for investors and analysts alike. Let’s have a look at the latest additions to FinBrain.
LinkedIn Company Data for Thousands of US&World Stocks
FinBrain Terminal has expanded its suite of innovative tools by integrating LinkedIn Company Data, a feature that offers unique insights into publicly traded companies.
This addition significantly enhances the depth of analysis available to users, providing valuable data that can indicate a company’s future growth potential.
Key Metrics from LinkedIn
The LinkedIn Company Data feature focuses on three primary metrics:
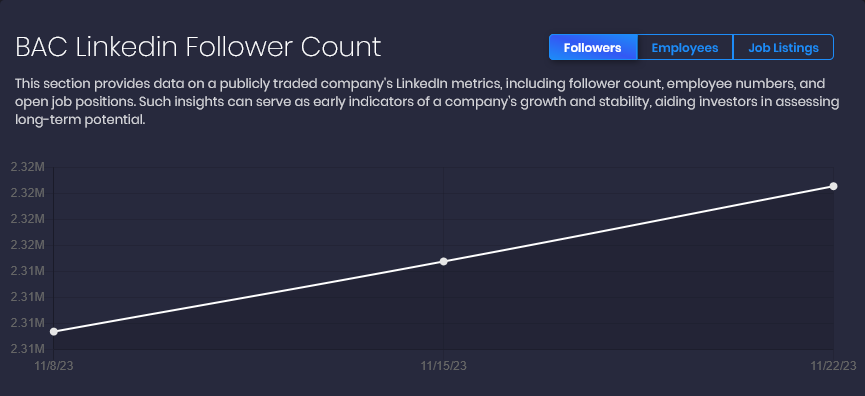
- Follower Count: The number of followers a company has on LinkedIn can be a strong indicator of its brand presence and public perception. A growing follower count often correlates with increasing brand awareness and market influence.
- Employee Count: Observing the changes in a company’s employee count over time can provide insights into its growth trajectory. An increasing employee count may signal expansion and scaling efforts, while a decreasing count could indicate potential challenges.
- Open Job Position Count: The number of open job positions at a company is a direct indicator of its growth strategy. A high number of open positions can suggest aggressive expansion plans, while few open positions might reflect a more conservative growth approach or potential internal restructuring.
Early Signals of Future Growth
These LinkedIn metrics offer early signals about a company’s future growth. For instance, a steady increase in followers and employees, coupled with a high number of open job positions, could suggest that the company is gearing up for expansion, potentially leading to future financial success.
Wide Market Coverage
Currently, the LinkedIn Company Data feature is available for all stocks listed under key markets, including the DOW 30, S&P 500, NASDAQ, NYSE, Tadawul TASI, Germany DAX, UK FTSE100, Mexico BMV, and OTC markets. This broad coverage ensures that users have access to these insights across a diverse range of companies and industries.
Company Financials Data
FinBrain Terminal has further augmented its capabilities with the addition of comprehensive company financials data to its ticker pages. This significant enhancement provides users with in-depth financial information for thousands of stocks in US and world stock markets, directly accessible on each ticker’s individual page.
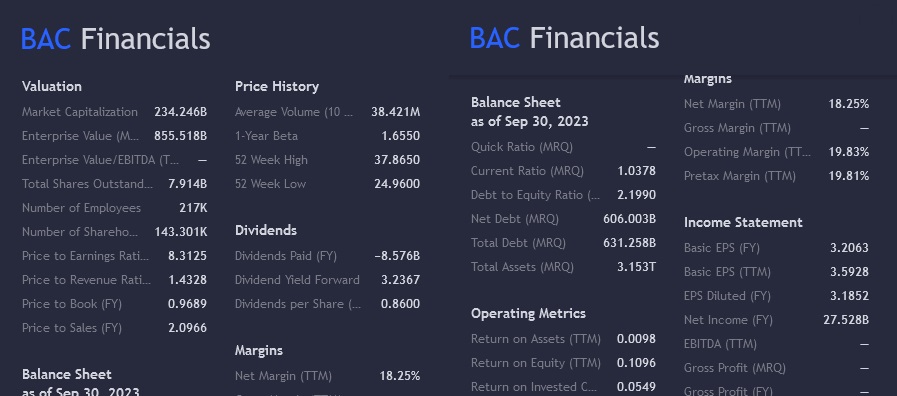
Comprehensive Financial Data Coverage
The company financials data feature encompasses a wide array of critical financial metrics, ensuring that users have access to all necessary information to make informed investment decisions. This data includes:
- Valuation Metrics: Users can analyze a company’s market valuation, including metrics such as market capitalization, P/E ratio, and other valuation ratios, providing a snapshot of the company’s financial worth and investment attractiveness.
- Price History: Historical price data gives insights into the stock’s performance trends over time, aiding in understanding its volatility and market behavior.
- Balance Sheet Details: Access to a company’s balance sheet provides a clear view of its financial health, including assets, liabilities, and shareholder equity, which are crucial for assessing financial stability and risk.
- Dividends Information: Detailed data on dividend payments, including dividend amounts and yields, helps users understand the stock’s income-generating potential.
- Profit Margins and Income Statement: These metrics offer a deep dive into the company’s profitability, revenue streams, and operational efficiency, as reflected in its income statement.
- Operating Metrics: A range of operating metrics sheds light on the company’s day-to-day operational performance and efficiency.
User-Friendly Presentation
This financial data is presented in a user-friendly format, positioned conveniently next to the pricing chart on each ticker’s page. This strategic placement allows users to correlate financial data with stock price movements, facilitating a holistic analysis of the stock.
Broad Market Accessibility
The company financials data feature covers a vast array of stocks from various markets, including those in the US and across the globe. This extensive coverage ensures that users have a wide range of options for analysis and investment.
Advanced Filtering Feature under FinBrain Terminal
The advanced filtering capability stands out as a pivotal tool, allowing users to navigate the complexities of stock markets with greater ease and precision.
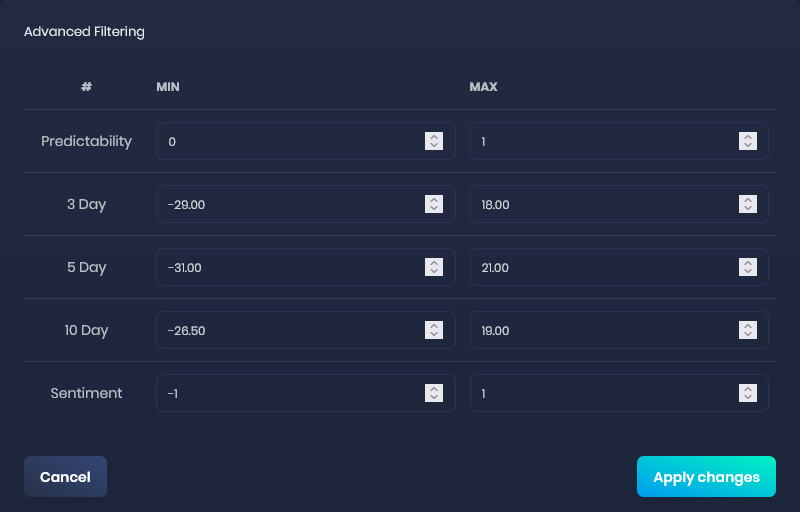
At the core of this new feature is the ability to filter stocks across various markets based on several key parameters. These include:
- Predictability Score: This metric offers insights into the reliability of the forecasts for each stock, enabling users to focus on stocks with the highest predictability.
- Forecasted Change Values: Users can filter stocks based on their anticipated price changes over different time horizons, such as 3-day, 5-day, and 10-day periods. This flexibility allows for tailored strategies to suit short-term traders and long-term investors alike.
- Sentiment Score: The sentiment score, derived from news and market data, provides a measure of the overall market sentiment towards a stock. By filtering stocks with the highest sentiment scores, users can identify those that are receiving the most positive attention in the media and market analyses.
FinBrain Technologies
www.finbrain.tech
[email protected]
99 Wall St. #2023 New York, NY 10005
Twitter • LinkedIn • Instagram • Facebook