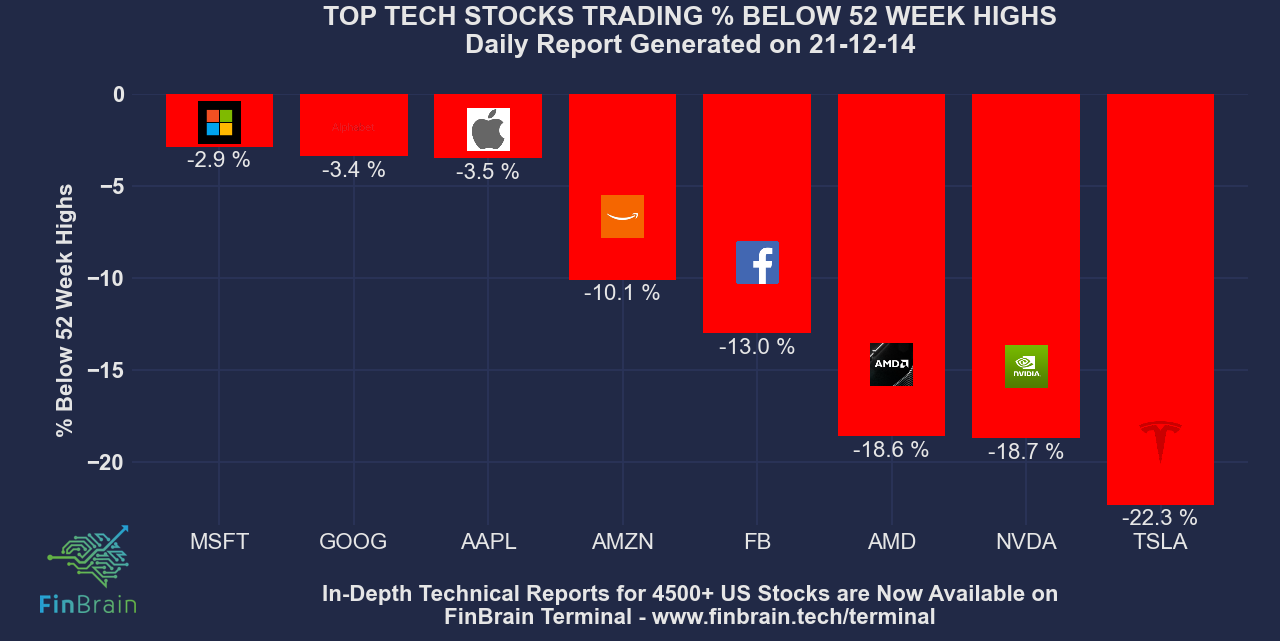
Here is the data showing where the top tech stocks are trading right now, compared to their 52 week highs.

The stocks didn’t perform well on November and the growth and tech stocks are losing steam during the first half of December. MSFT, GOOG and AMZN were the top tech stocks that kept rising during the recent “kangaroo” market. However, AMD, NVDA and TSLA closed the trading day approximately 20% below their 52 week highs. The investors are getting ready for the FED’s rate hikes and these expectations are getting priced in.
Do you think this trend will continue, or does it make the perfect buying opportunity?
Figure it out on FinBrain Terminal. Explore what AI driven predictions, technical reports and news sentiment data are saying about 4500+ US Stocks. Beat the markets by following company insider trades as well as US House and Senate trades listed on each ticker’s page on FinBrain Terminal. Newly added app store data can also be the perfect leading indicator you were looking for in order to forecast the next revenue figures for the publicly traded companies that have mobile apps.
Speaking of technical reports, we would like to present you with a complimentary technical report for MSFT – Microsoft Corp. below. These reports can give you a massive in-depth look from different perspectives by incorporating fundamental, technical, options and alternative data together.
MSFT price has changed 1.32 % within the last 3 days and changed -0.92 % yesterday. Microsoft Corp. closed the trading day at 339.40, which is 1.34 % above its 200-day moving average. The last close was -2.94 % lower than the last 52-week’s highest close price of 349.67.
The asset price is in the neutral area with RSI at 58.3. MSFT’s last close price was between Upper and Middle Bollinger Bands. MACD is in the bearish area and the histogram value has increased compared to the day before.
Options Activity for MSFT
Options buying, selling and hedging activities by the market makers are some of the strongest drivers of the market movements. Hence, it could be a wise move to keep an eye on the put/call volume ratios and the unusual options activities. Put-call ratio for MSFT based on total traded volume is 1.15 and based on total open interest is 1.08. The options traders are making bearish bets on the stock.
Short Float, Insider and Institutional Holders Data for MSFT
0.54 % of the float for MSFT shares is shorted. 0.07 % of the company shares are held by the insiders and 71.88 % of the shares are held by the institutions. Top 3 institutional holders of MSFT are Vanguard Group, Inc. (The) (8.18%), Blackrock Inc. (6.75%) and State Street Corporation (3.92%). The next earnings date for the Microsoft Corp. is 01/24/2022. Earnings estimate average is $ 2.07, where the estimated values vary between the range [2.01, 2.17]. The revenue estimate average is $ 44B, where the estimated values vary between [43.6B, 44.8B]. Last 3 months’ analyst recommendations are as the followings, 5 Buy (41.67 %), 5 Overweight (41.67 %), 2 Outperform (16.67 %).
AI Driven Sentiment Analysis Data for MSFT
FinBrain’s sentiment analysis algorithms collect the most up-to-date news headlines for Microsoft Corp. from 20+ major financial news sources everyday before the markets open. The market sentiment for MSFT is in the positive territory and the sentiment score is 0.26. FinBrain’s sentiment score is a value scaled between [-1, 1] where a value close to -1 indicates a strongly negative sentiment and a value close to 1 indicates a positive sentiment. The last 10 days’ data can be seen on the sentiment analysis chart and the full historical range can be retrieved using FinBrain API.
Exclusive Data on FinBrain : App Store Scores and Review Counts for MSFT
FinBrain’s exclusive mobile app store ratings dataset contains the weekly scores and review counts for the mobile apps of the publicly traded companies. The data for 250+ S&P500 companies gets collected every Friday and our special report evaluates how the scores and review counts have changed compared to the previous week’s numbers. MSFT’s flagship app Microsoft Office: Word, Excel, PowerPoint & More had 797,860 reviews on 2021-12-03 and 816,380 on 2021-12-10. The review count has increased by 18,520 (2.32 %). The app’s overall score was 4.56 on 2021-12-03 and 4.58 on 2021-12-10. The score has increased by 0.02 (0.44 %). This alternative dataset can be used as a leading indicator to understand how the users like the company’s mobile services, which can affect the company’s revenue figures directly.
You can explore the AI driven and alternative data for MSFT stock on FinBrain Terminal.
FinBrain Technologies
www.finbrain.tech
[email protected]